
Introducing Enterprise Productivity Metrics
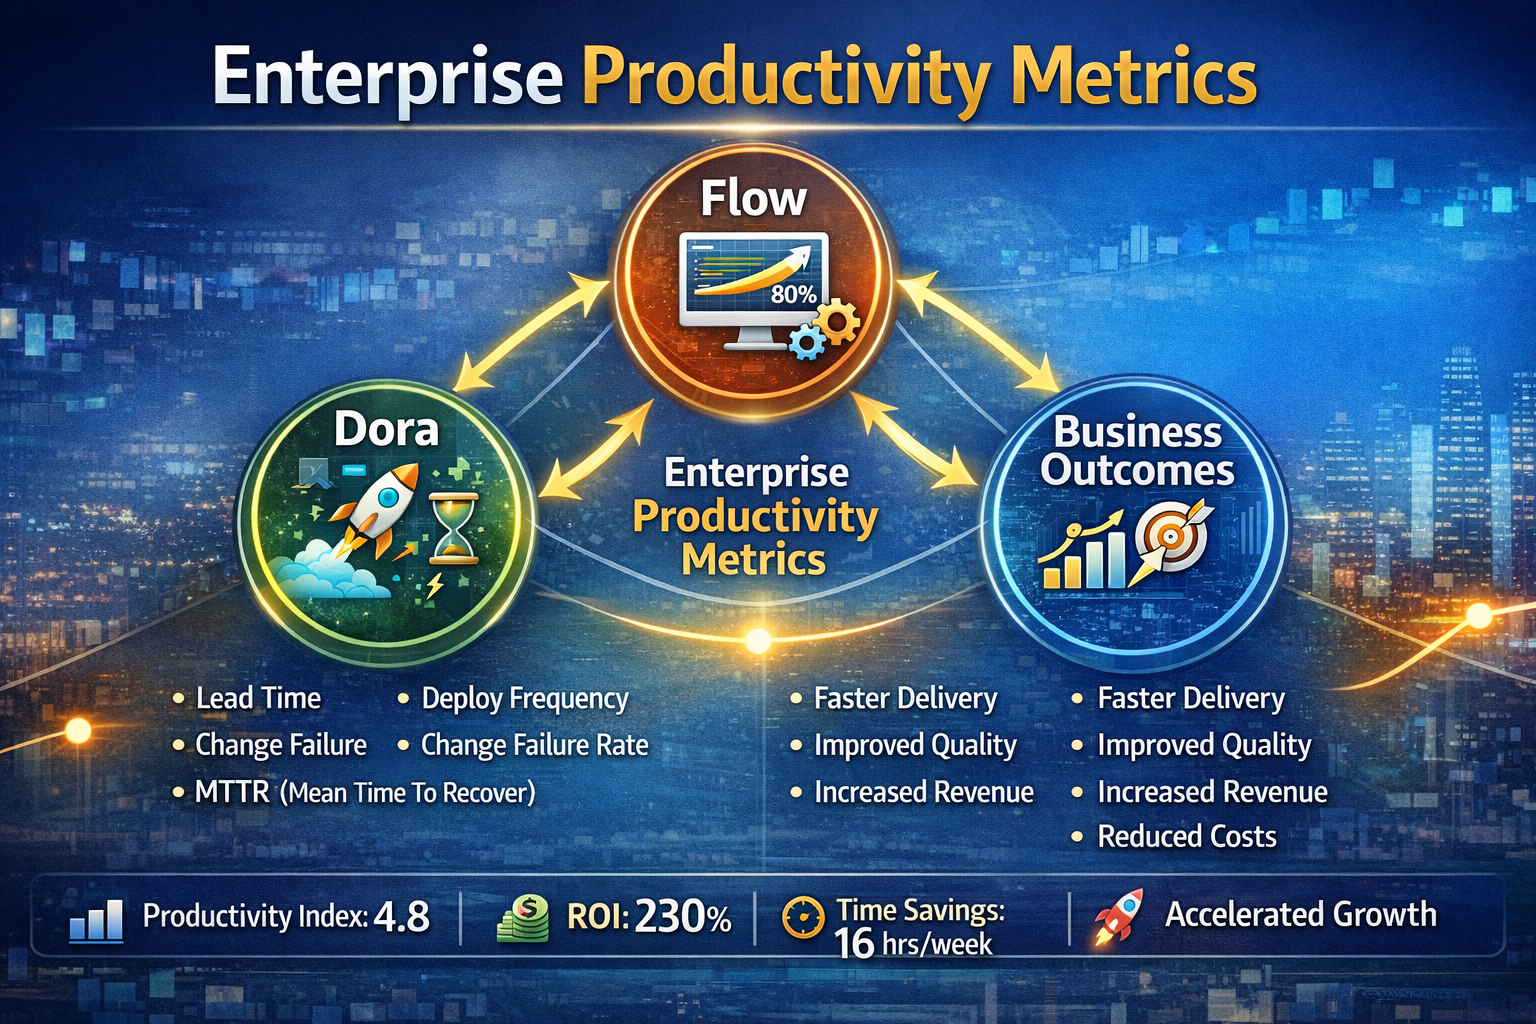
image generated by whimsical diagrams
For years, story points and velocity have been treated as proxies for productivity in agile organizations. What began as a lightweight planning aid inside small, co-located teams has quietly morphed into something far more consequential: an enterprise performance signal.
That shift has come at a cost.
Across many large organizations, story points are now aggregated, compared, normalized, and reported upward — often to leaders far removed from the teams doing the work. The result provides an illusion of precision that masks true productivity, penalizes critical work, and incentivizes the wrong behaviors.
This article explains why story points fail as enterprise productivity metrics, what actually happens when they are misused at scale, and how leading organizations are replacing them with evidence-based alternatives that better reflect value, flow, and sustainability.
Image generated by ChatGpt
What Story Points Were Actually Designed to Do
Story points were created to support relative estimation within a single team. They help teams answer a narrow question:
“How much effort does this work represent compared to other work for us?”
Each team calibrates story points based on its own:
Skill mix
Technology stack
Codebase maturity
Domain complexity
Risk tolerance
A five-point story for one team may take two hours; the same five-point story for another may take two days. That variability is not a flaw — it’s the design.
Ron Jeffries, co-creator of Extreme Programming and the original inventor of story points, has been explicit on this point:
“Story points are not intended to be compared across teams.”
Using story points outside their original context is not an agile evolution — it’s a category error, similar to using body mass index to compare professional athletes across different sports.
Why Story Points Break at Enterprise Scale
When story points are rolled up across teams, portfolios, or value streams, context collapses.
Consider three common enterprise teams:
Security or compliance teams, whose work is dominated by risk mitigation, audits, and threat modeling
Platform and infrastructure teams, whose value lies in enablement rather than feature throughput
Innovation teams, operating in uncertainty where learning — not speed — is the primary output
These teams often appear “slow” when measured by velocity, yet they create disproportionate enterprise value.
Aggregating story points flattens this nuance. It treats all work as interchangeable units of effort, ignoring:
Technical debt reduction
Architectural enablement
Risk containment
Long-term scalability
In doing so, organizations systematically undervalue the work that makes everything else possible.
Velocity Measures Activity, Not Value
Velocity answers one question well:
“How much work did we estimate and complete?”
It does not answer:
Did customers benefit?
Did risk decrease?
Did quality improve?
Did cycle time shrink?
Did resilience increase?
In working alongside agile teams for 10 years, the unanswered questions are desperately desired by leadership. The trouble is that most don’t understand agile enough to ask the right questions, which tempts them to use what they think is the low-hanging fruit. You know… whatever is lying on the ground.
Doing this makes matters worse. Research from McKinsey in a recent article entitled, “Yes, you can measure software developer productivity” (2023), highlights how traditional productivity metrics often create false indicators of progress while obscuring the real drivers of performance:
When velocity becomes the signal leaders care about, teams naturally optimize for it — even when that optimization reduces real value. This is how the organization employs the ‘watermelon’ indicator. When the program looks green on the outside, but is really red on the inside.
Goodhart’s Law and the Gaming Effect
“When a measure becomes a target, it ceases to be a good measure.”
This principle — known as Goodhart’s Law — explains why velocity-driven systems produce predictable dysfunction:
Estimate inflation to make numbers look better
Artificial story splitting to boost throughput
Metric protection instead of customer focus
These are not moral failures. They are rational responses to incentive structures.
The system teaches teams what to care about, and they listen.
Why the Best Teams Often Look “Slow”
One of the most counterintuitive truths in enterprise delivery is this:
High-performing teams often have lower velocity.
We see this to be true because:
They tackle foundational problems
They invest in architecture and platforms
They reduce the future cost of change
They enable dozens of downstream teams
Google’s DevOps Research and Assessment (DORA) program has repeatedly shown that speed and stability are not trade-offs — but only when productivity is measured correctly.
Teams doing the hardest, most valuable work frequently appear unproductive by velocity metrics — while quietly accelerating the entire organization.
What High-Performing Organizations Measure Instead
Leading enterprises are shifting from effort-based metrics to flow and outcome-based measurement systems.
1. Flow Metrics
Flow metrics measure how work moves through the system and include the following:
Lead time: The total time from when work is requested or committed to when it is delivered to the customer.
Cycle time: The time it takes to actively work on an item — from when work begins to when it is completed.
Throughput: The amount of work completed in a given period of time.
These metrics reveal bottlenecks, variability, and predictability — without distorting behavior.
2. DORA Metrics (The Gold Standard)
Backed by research across 30,000+ organizations, DORA metrics correlate strongly with business performance:
Deployment frequency: How often an organization successfully deploys code to production.
Lead time for changes: The time it takes for a code change to go from commit to running in production.
Change failure rate: The percentage of deployments that result in incidents, rollbacks, or service degradation.
Mean time to restore (MTTR): The average time required to restore service after a production failure.
3. Business Outcomes
Productivity without outcomes is noise. Mature organizations connect delivery to:
OKRs: Objectives and Key Results
Customer satisfaction: The degree to which a product or service meets or exceeds customer expectations.
Revenue or cost impact: The measurable financial effect of work delivered, including revenue growth, cost savings, or cost avoidance.
Risk reduction: The extent to which work lowers the likelihood or impact of operational, security, compliance, or business risks.
Team Health
Sustainable productivity requires:
Psychological safety
Manageable cognitive load
We know that a burned-out team does not create durable value.
Practical Guidance for Leaders
If your organization currently uses story points, the answer is not to abolish them — but to encourage decision makers to put them back where they belong.
Do this instead:
Keep story points local to teams for planning
Stop comparing or ranking teams by velocity
Adopt flow and DORA metrics for enterprise visibility
Tie delivery discussions to outcomes, not output
Review work for learning, not judgment
The most powerful leadership question shifts from:
“How many points did you deliver?” to “What value did we unlock, and what did we learn?”
Measuring What Actually Matters
Story points are not bad. Misuse is.
When enterprises confuse effort with productivity, they reward the appearance of progress while quietly eroding real performance. Measuring what matters — flow, quality, outcomes, and team health — requires more discipline, but it produces organizations that are faster, more resilient, and better aligned with customer value.
The goal isn’t more points. Instead, it’s better systems.